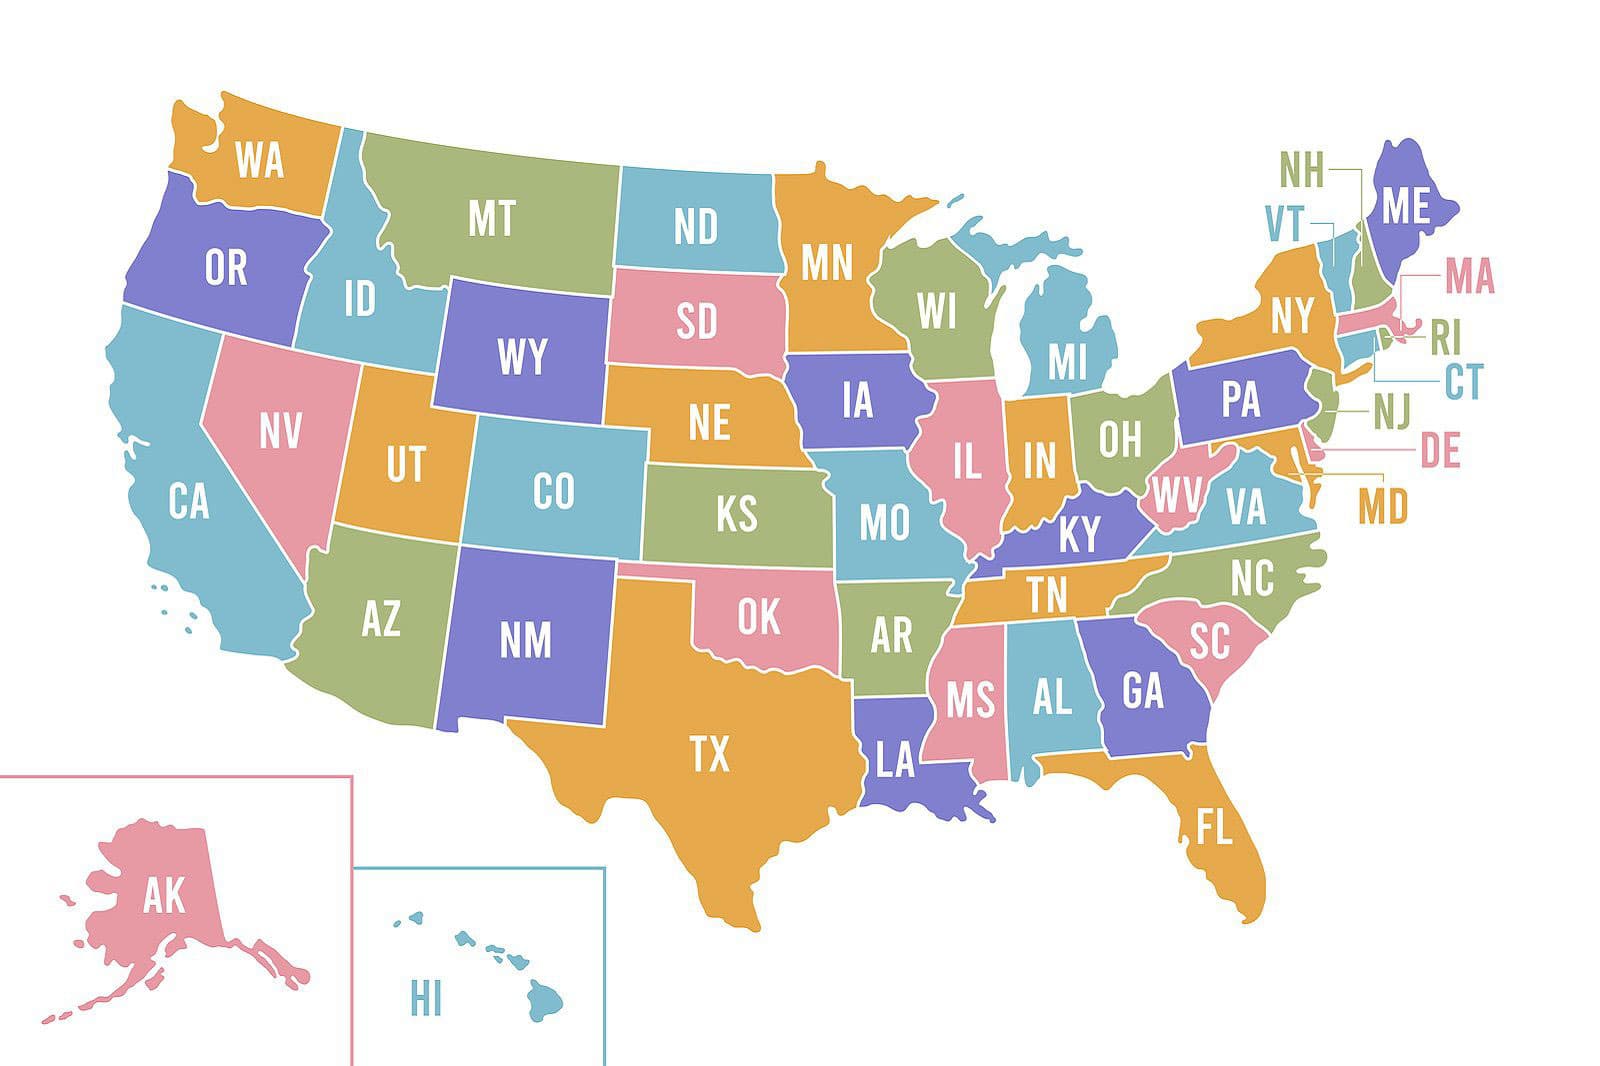
Investors focus on regions with zero state income tax and clear landlord-friendly legal frameworks.
Macroeconomic Parameters and Sun Belt Leaders
States with low tax burdens and expanding industrial bases attract the highest volumes of institutional capital.
| Region / Metro Area | Average Cap Rate | Key Driver |
|---|---|---|
| Dallas-Fort Worth, TX | 5.2% – 6.1% | Corporate Relocation |
| Tampa & Miami, FL | 4.8% – 5.8% | Population and Capital Inflows |
| Raleigh-Durham, NC | 5.0% – 5.7% | Tech and Healthcare |
| Atlanta, GA | 5.5% – 6.3% | Logistics and Transportation |
| Indianapolis, IN | 7.1% – 8.5% | Affordable Price per Sq. Ft. |
1. Texas (Dallas-Fort Worth Metroplex and Austin)
Texas leads in capital deployment due to its zero state income tax. The Dallas-Fort Worth (DFW) metroplex adds 100,000 to 120,000 residents annually, driven by corporate headquarters relocating from California and New York.
- Rental Yield (Cap Rate): 5.2%–6.1% for Class B/A Multifamily assets.
- Capital Appreciation: 6%–8% annually.
- Tax Environment: Effective property tax rates average 1.6%–2.2% of assessed value.
- Priority Segments: Multifamily housing complexes, last-mile logistics facilities.
2. Florida (Miami, Tampa, and Orlando Metros)
Florida shows strong inflows of high-net-worth individuals and institutional capital. Miami serves as the primary financial hub for Latin American and MENA capital, maintaining steady demand for prime residential and office space. The Tampa and Orlando metros deliver consistent yields in long-term residential rentals.
- Rental Yield (Cap Rate): 4.8%–5.8%.
- Ownership Considerations: Zero state income tax is offset by higher property insurance costs for natural disasters (Flood/Hurricane Insurance), ranging from $2,500 to $4,500 annually per residential property.
- Priority Segments: Build-to-Rent (BTR) single-family homes, Class A commercial property.
High-Tech and Logistics Hubs of the East
Regions with dense concentrations of universities, research centers, and freight arteries generate a solvent tenant base.
3. North Carolina (Research Triangle and Charlotte)
The Research Triangle region (Raleigh, Durham, Chapel Hill) concentrates technology corporations, pharmaceutical giants, and research universities. Median household income in the region exceeds the national average by 18%, minimizing rent default risks. Charlotte stands as the second-largest banking center in the US after New York.
- Rental Yield (Cap Rate): 5.0%–5.7%.
- Tax Environment: Flat state income tax rate of 4.5%, with planned reductions.
- Legal Framework: Court-ordered eviction timelines for non-payment average 20–30 days, protecting investor operational cash flows.
4. Georgia (Atlanta Metro)
Atlanta serves as the primary transportation and logistics node of the US Southeast. Hartsfield-Jackson International Airport and an extensive rail network drive demand for flex-space commercial warehouses and hybrid logistics infrastructure.
- Rental Yield (Cap Rate): 5.5%–6.3% for industrial facilities; 5.2%–6.0% for residential assets.
- Rent Growth: 4.5%–6.0% annually.
- Priority Segments: Industrial parks, flex warehouses, Class B multifamily.
High Current Cash Flow in the Midwest
Investors seeking maximum immediate cash flow with a low entry threshold target the industrial centers of the Midwest.
5. Indiana (Indianapolis)
Indianapolis combines affordable cost per square foot with high rental yields. The city operates as a major US distribution hub where five Interstate highways converge.
- Rental Yield (Cap Rate): 7.1%–8.5%.
- Price-to-Rent Ratio: Enables leveraged cash-on-cash returns of 8%–10% annually.
- Entry Threshold: Single-family property values start at $180,000–$250,000—roughly half the cost seen in Florida or Texas.
| Strategy | Target Regions | Financial Profile |
|---|---|---|
| Capital Appreciation | Texas, Florida | Lower Cap Rate, strong capital growth |
| Balanced Yield | North Carolina, Georgia | Moderate Cap Rate, high household income |
| Cash Flow | Indiana | High Cap Rate, stable rental demand |
Regulatory Framework and Deal Structuring
Regional selection must account for state tenant laws and tax regulations.
Eviction Timelines
Texas, Florida, Georgia, North Carolina, and Indiana fall under landlord-friendly jurisdictions. Terminating a lease agreement for non-payment takes between 21 and 45 days. In tenant-friendly states (California, New York, Illinois), rent control laws and court delays extend the process to 6–12 months.
Tax Structuring
Foreign investors structure acquisitions through legal entities (Delaware LLC or local LLCs) to shield capital from US Estate Tax (up to 40%) and FIRPTA withholding (15% of gross disposition proceeds). Acquiring real estate in states with no personal income tax (Texas, Florida) limits income tax liabilities strictly to the federal level (10% to 37% based on net income).
To reduce taxable income, investors utilize accelerated depreciation via Cost Segregation Studies, writing off up to 20%–30% of building component costs in Year 1.
This material is for general information only and does not constitute legal, immigration, investment, or tax advice. Program requirements and processing practices may change. Individual results depend on the applicant’s circumstances, visa availability, USCIS decisions, and project performance.